Our Enterprise Suite combines all of our
laboratory test software and includes our compaction quality control software.
This is the ultimate solution for full service soils laboratories. Since it is a
collection of programs, and not an individual program, please refer to the web
pages for each of the programs included.
ASTM C136 • ASTM D422 • ASTM D1140 •
ASTM D6913 • AASHTO T 11 • AASHTO T 27 • AASHTO T 88 •
Australian Standard AS 1141.11 •
State DOT StandardsASTM C136 • ASTM D422 • ASTM D1140 •
AASHTO T 11 • AASHTO T 27 • AASHTO T 88 •
Australian Standard AS 1141.11 •
State DOT Standards
Sieve tests can utilize multiple sample splits
Conformance to specification can be reported for selected sieves
Specifications are stored in a program-maintained database for reuse on subsequent tests
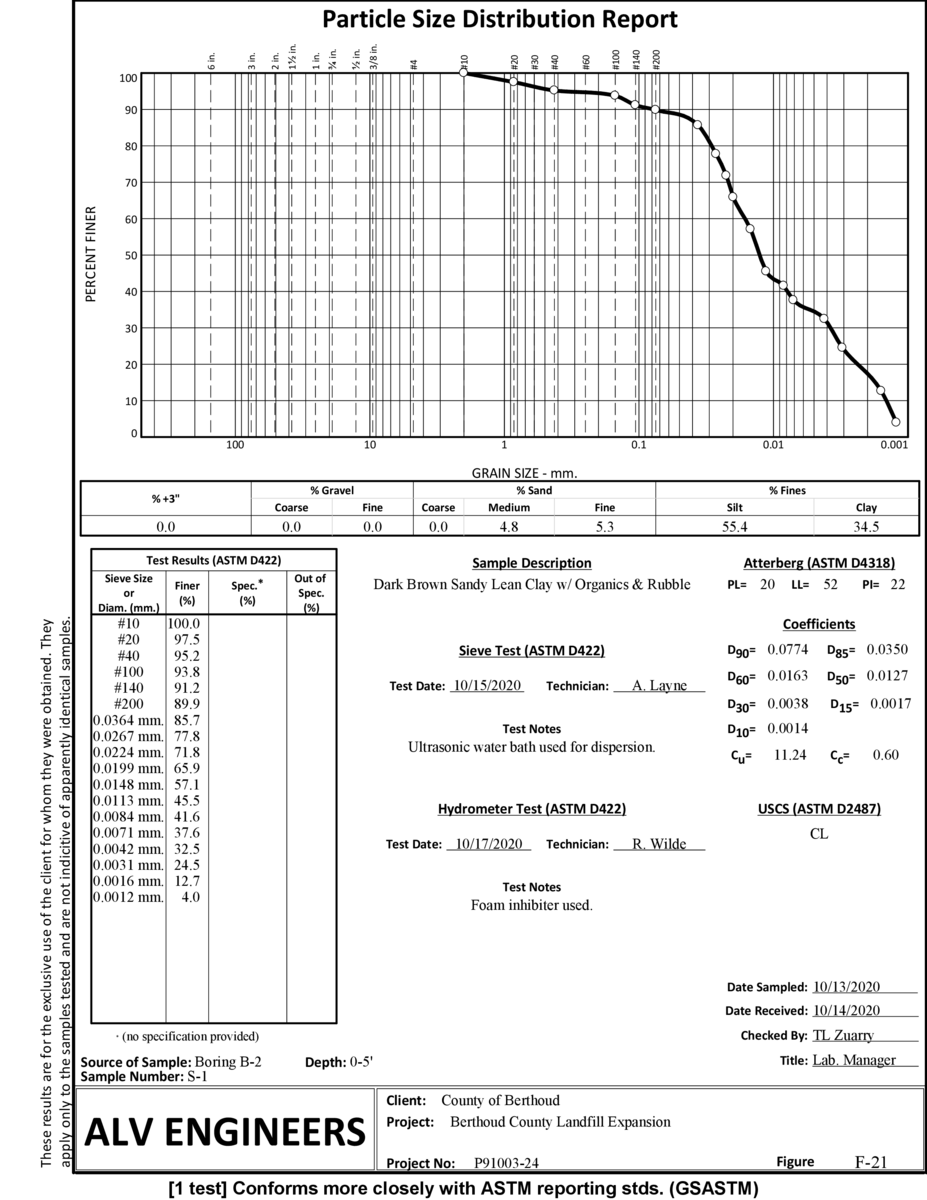
A composite particle size distribution curve is built from sieve and hydrometer tests performed on a single split sample
Fractional percentages (e.g., percent gravel, coarse, medium and fine
sand, etc.) are calculated and reported. Percentages can be calculated using the particle size divisions specified by ASTM, AASHTO, Burmister, Wentworth, CanSIS, BS 5930 and others.
Diameters at various retained percentages (e.g., D10,
D30, D60), coefficients of concavity and uniformity (Cc and Cu) fineness modulus results are automatically calculated from the particle size distribution curve
Curves may be plotted on semi-log, Wentworth (Phi), .45 power, log(size) vs. probability or linearly-scaled charts
Charts can also include specification envelopes indicating conformance to user-entered specifications
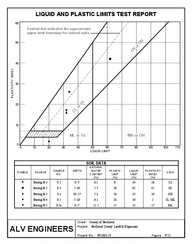
Atterberg standards: ASTM D4318 • AASHTO T 89 • AASHTO T 90 • Australian Standard 1289.3.1.1, 1289.3.2.1 and 1289.3.3.1
Index values (Atterberg liquid and plastic limit, plasticity and liquidity index) are automatically calculated from raw moisture content data and blow counts
One-point liquid limits are supported
Natural moisture contents are calculated via ASTM D2216
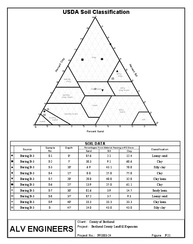
Using particle size and Atterberg data the program can automatically classify soils using a number of different methods, including USCS (ASTM D 2487) AASHTO M 145 (aka ASTM D3282), USDA, Burmister and AS 1726.
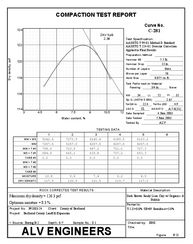
Moisture-density test standards: ASTM D558 • D698 • ASTM D1557 • ASTM D4718 •
AASHTO T 99 • AASHTO T 180 • AASHTO T 224 •
California Test Method 216 •
User-Defined + State DOT Standards
Optimum moisture and maximum dry density results are automatically calculated from the mathematically-modeled moisture vs. density curve
Results can be automatically corrected for the presence of oversize (rock) material
Oversize correction supports the coarse/fine mass ratio oversize percentage determination per D4718
User-defined test specification table allows you to add support for DOT-specific blows/layers/mold diameter requirements
When matched with curves form multi-point tests on similar soils, moisture-density curves may be synthesized from one-point Proctor tests
Container weight database: The software can be set up to keep a list
of IDs and weights for moisture content containers
Selectively omit compaction test points from the moisture-density
curve
Moisture-density test results rounding are selectable on a per-test
specification basis (e.g., ASTM D 698 requires rounding the maximum
dry density and optimum moisture content to the nearest 0.1, while D 1557 requires rounding to the nearest 0.5)
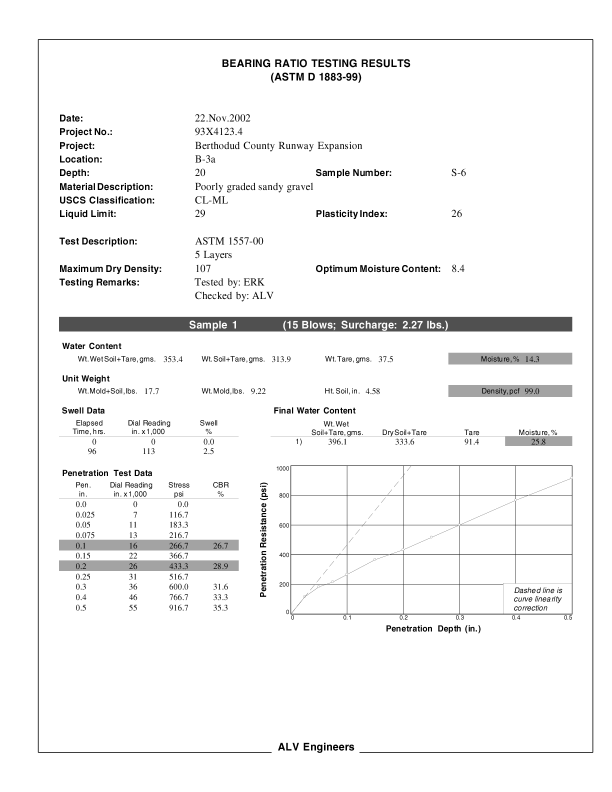
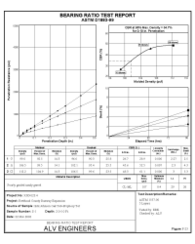
CBR test standards: ASTM D1883 • AASHTO T 193 • Virginia Test Method 8
User-adjustable linearity correction
Swell data is supported but not required
Optionally, the program will interpolate data to determine the CBR
at 95% maximum dry density
The test report presents the load-penetration curve and the test
results for up to three specimens
The report may also include swell-time graphs and CBR vs. percent
compaction graphs
CBR can import data acquisition files created by the DGSI (Durham Geo)
automated load frame, and can also be configured to import data
acquisition files created by customized data acquisition systems
Both Imperial and metric units are supported; data may be entered
in one system and automatically converted to the other for reporting.
Calculates UU, CU, CU with pore pressures, and CD triaxial tests.
3 triaxial test report formats
Interactively adjust the strength tangent envelope
Plot pore pressure versus strain and the stress path diagram for
triaxial tests
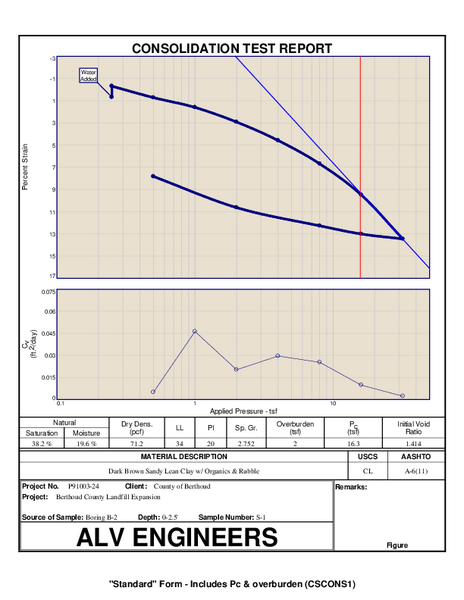
Calculates moisture, density, saturation and void ratio for initial,
saturated, and consolidated phases
Staged load ring constants are permitted, as well as separate constants
for each specimen
Direct shear and triaxial tests may have up to four specimens
Four separate unconfined tests may be combined in a single report
A data and results summary may be printed for each specimen
Units of measure supported are cm, inches, lbs, gms, kN, psf, psi,
ksf, tsf, ksi, kPa, and mPa
Click here to
view a set of datafiles used to test SHEAR's calculations. (The
calculations documented in these files can help you in manually verifying
the program's correctness.)
Testing data can be imported from files created by a number of different data acquisition systems
Price to upgrade a current LabSuite license to an Enterprise Suite license
The
individual programs that make up Enterprise Suite are
site licensed. One license fee covers unlimited installations at
a single address and there are no ongoing maintenance costs.


